
Artículo wiki · Colección 06
Carga de Flotas
Referencia técnica sobre Carga de Flotas para el diseño, integración e implementación de sistemas de energía inalámbrica.
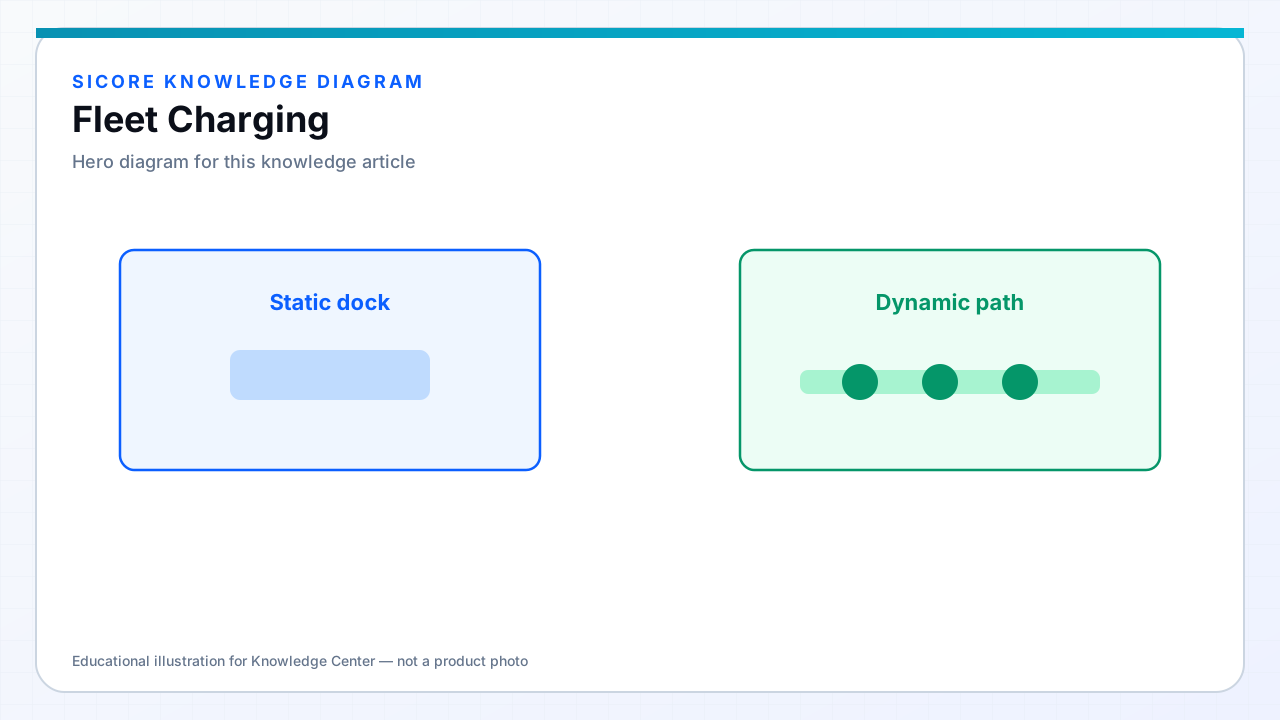
Fleet charging treats energy as a fleet-wide resource, not a per-robot convenience. Given N robots, mission energy draw, available dock windows, and charge rates, the question is whether the installed pad capacity sustains peak shift throughput — or whether robots queue, miss missions, or carry oversized batteries to compensate.
SiCore fleet charging analysis starts from duty cycle simulation: route distances, payload profiles, idle dwell at stations, and acceptable SOC floors at mission start.
01Sizing inputs
- Peak concurrent robots needing charge vs total pad count and aisle access conflicts.
- Wireless charge rate at expected alignment quality — not datasheet peak in lab conditions.
- Battery capacity and chemistry limits on charge acceptance during short dock windows.
- Shift structure: single continuous run vs staggered breaks that create charge opportunity.
02Mixed fleet considerations
Warehouses often run multiple vehicle types on shared aisles. SiCore multi-profile docks serve different receiver footprints and power classes, but fleet charging plans must account for incompatible pad assignments and routing to the correct station type. Universal pads reduce routing complexity at higher hardware cost.
03Operational metrics
Track fleet-level charge minutes, pad utilization, average SOC at mission release, and charge-related mission delays. SiCore cloud dashboards aggregate per-pad and per-vehicle data so capacity additions are data-driven — adding pads where utilization exceeds target, not where installation is easiest.