
Artículo wiki · Colección 08
Detección de Fallas
Referencia técnica sobre Detección de Fallas para el diseño, integración e implementación de sistemas de energía inalámbrica.
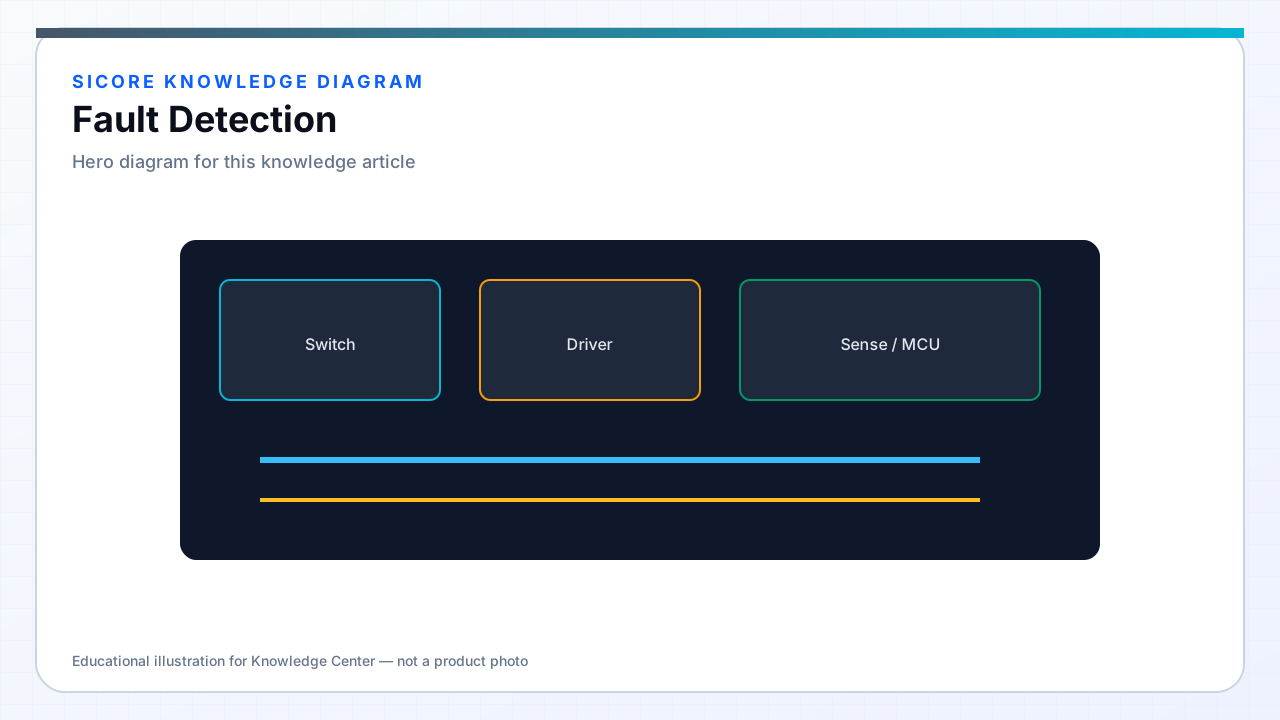
Fault detection must identify abnormal conditions before damage to coils, FETs, or vehicle packs — and must fail safe when sensors or software themselves degrade. SiCore implements defense in depth: analog comparators and gate-driver fault pins act in microseconds; firmware monitors trends over milliseconds; session-level logic enforces BMS and fleet rules over seconds.
Wireless charging adds faults absent in wired chargers: misalignment power loss, foreign metal heating, living-object proximity, and split control between pad and vehicle with independent reset domains.
01Fault categories
- Electrical: over-current, over-voltage, DC bus collapse, isolation failure, shoot-through indication.
- Thermal: FET, coil, or receiver PCB overtemperature with hysteresis and latch rules.
- WPT-specific: FOD power imbalance, detuning beyond bounds, excessive reflected power.
- System: BMS deny, CAN timeout, alignment lost during transfer, vehicle motion while energized.
- Self-test: ADC out-of-range, stuck PWM feedback, configuration CRC failure at boot.
02Detection and response staging
Tier 1 hardware latches disable PWM outputs and notify firmware via fault IRQ. Tier 2 software derates power when rolling averages cross warning thresholds — receiver coil temperature rise without hard limit yet. Tier 3 session abort sends structured fault codes on CAN and fleet link, opens contactor request line, and ramps transmitter power to zero with documented timing.
SiCore fault matrices map each code to allowed recovery: auto-retry after cooldown for transient alignment loss; latched maintenance required for repeated FOD trips or comparator hardware fault.
03Logging and fleet visibility
Circular fault history in NVM captures timestamp, active power, alignment metric, and last BMS current request for post-incident review. Fleet dashboards aggregate fault rates per pad ID and vehicle ID to distinguish infrastructure misalignment from receiver degradation. Fault injection tests during factory acceptance verify each tier before site energization.