
Wiki article · Collection 09
Thermal Simulation
Engineering reference on Thermal Simulation for wireless power system design, integration, and deployment.
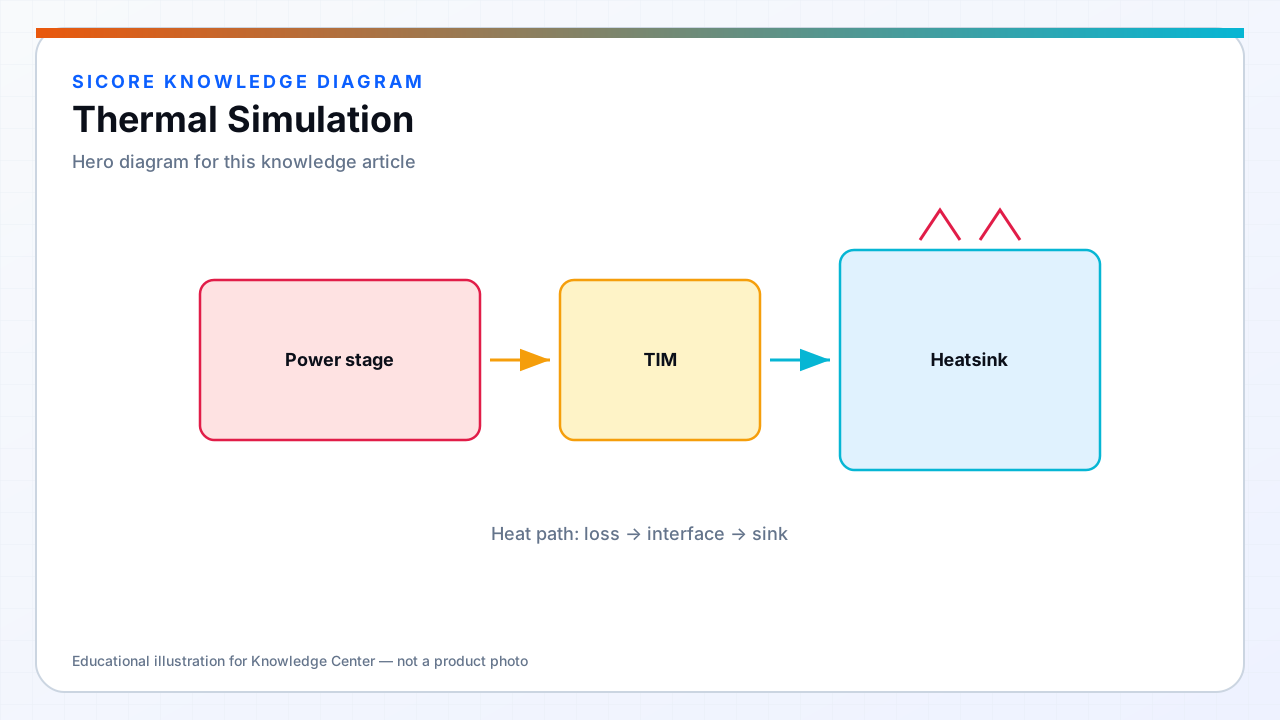
Analytical lumped models suffice for early feasibility, but industrial wireless charging products require simulation that captures spatial hotspots: FET die under gate driver shadow, ferrite center-leg temperature rise, and PCB trace heating on multi-oz copper carrying 100 A secondary current. SiCore uses thermal simulation to lock mechanical stack-ups before tooled dock plates and receiver enclosures commit to production.
Simulation inputs come from electrical design: switching loss vs load tables from double-pulse tests, coil AC resistance vs frequency and temperature, and duty-cycle profiles derived from fleet telemetry — not continuous rated power alone.
01Model construction
- FEA steady-state and transient for conduction-dominant paths: FET-to-heatsink, ferrite-to-plate.
- CFD for enclosure airflow, dock pit geometry, and receiver chassis vent configurations.
- Loss maps: spatially distributed W/cm² on FET tops, ferrite volumes, and DC bus shunt zones.
- Material properties: temperature-dependent ferrite and copper resistivity, anisotropic PCB effective conductivity.
- Boundary conditions: warehouse ambient, concrete thermal mass for floor-mounted docks, solar load for outdoor pilot sites.
02WPT-specific simulation focus
Coil assemblies are modeled with split losses: copper I²R in windings, core Steinmetz or measured loss density at operating flux, and adjacent metal eddy heating from fringing fields. Misalignment scenarios increase secondary voltage and receiver rectifier loss — SiCore runs parametric sweeps at nominal and worst-case gap before signing thermal derating curves.
Dock designs with multiple coils simulate thermal crosstalk: an idle adjacent pad still warm from prior session heats shared enclosure air and raises baseline for the next vehicle. Transient simulation over back-to-back charge cycles validates fan hysteresis and firmware derating onset timing.
03Correlation and sign-off
Simulation correlates to hardware within agreed tolerance — typically ±5 °C on FET case and ±8 °C on ferrite bulk at rated power after 60-minute soak. Thermocouples attach at defined points matching model probes; IR images identify convection errors where emissivity assumptions were wrong. Correlation reports gate release of thermal derating tables embedded in firmware and fleet commissioning limits.